 IMZM Research Studio
Source-backed research workspace
Tools & analytics
Inspect the pictures and model in the paper, review its internal marketing variables, and compare coded metaphor references across services and employee tiers.
Tools
Use the source images and conceptual model while conducting or reviewing a ZMET interview.
ZMET picture bank
Choose the service setting and employee tier to inspect the exact pictures in the manuscript’s table. Ask the participant what each picture means; do not assign a meaning from the picture alone.
Seven giant metaphors

Figure 3: Balance, transformation, journey, container, connection, resources and control.
ZMET procedure
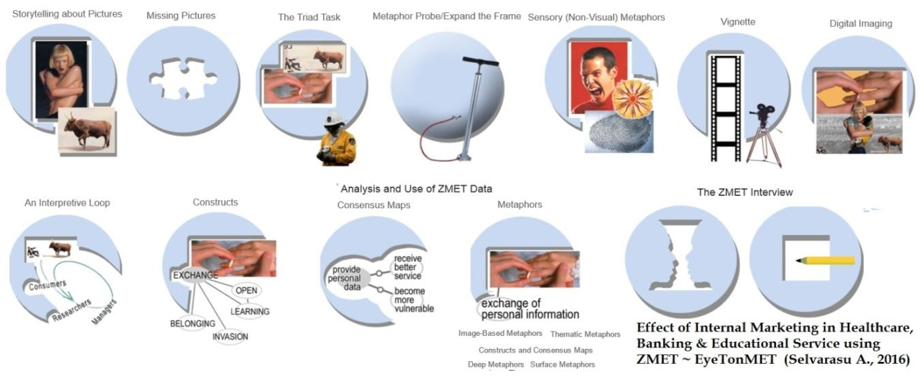
Figure 2 in the source manuscript. The guided study workspace supports recording the interview steps.
Conceptual model
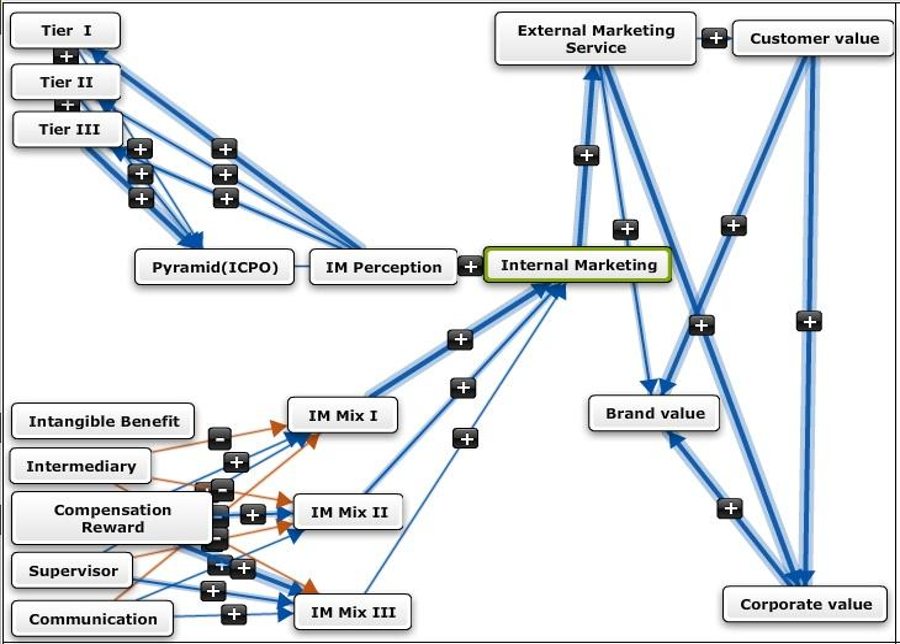
Figure 1 from the manuscript. The diagram proposes relationships among internal marketing activity, employee tiers and service value; it does not establish causal effects.
Analytics · metaphor codes
Explore Table 2 of the manuscript. These are coded references, not numbers of employees or measured service outcomes. Giant metaphor and associate code rows overlap conceptually; do not add them to estimate people.
Code comparison
Bar length is scaled to the largest code count within each comparison panel. Compare recorded counts, not rates; the manuscript does not supply code opportunities or interview length by cell.
Source code table
Columns follow the source order: Banking I–III, Education I–III, Healthcare I–III. The total is reported by the manuscript.
| Metaphor code | Type | Bank I | II | III | Edu I | II | III | Health I | II | III | Total |
|---|
IM Scale · variables and proposed additions
Table 3 subjectively matches existing coded IM Scale constructs with metaphor themes. The draft items below are new suggestions derived from themes in the paper; they are not validated scale items.
Source construct mapping · Table 3
| Component | Source code | Source wording | Paired metaphor in table |
|---|
The paired metaphor column preserves the row alignment printed in the manuscript. It is a subjective comparison, not a psychometric result.
Candidate variables for future validation
Use these as possible five-point agreement items only after expert review, cognitive interviews, piloting and checks for reliability and validity.
Source code comparison diagrams
The supplied comparison diagrams show banking, healthcare and education tiers. Open an image to inspect its labels; use the numeric table above for exact counts.
Source: A. Selvarasu, “Embedded Case Research of Internal Marketing on Service Performance,” supplied manuscript. Code table source note: QSR NVivo Pro 11, Selvarasu A. (2017). Figures and table values are reproduced from that source; candidate item wording is an IMZM adaptation.